Usage of Energy Resources Across Nations
- Jyotir Pant

- Sep 23, 2021
- 5 min read
In the previous article, we looked at how energy consumption and economic performance are related, using the data across various regions and by observing the trends in OECD and non-OECD nations. In this analysis, we will dig deeper and try to identify the patterns expressed by the data in terms of renewability, cleanliness and development of resources.
The data has been taken from The British Petroleum Company Limited, which provides detailed analysis on the energy consumption, reserves, fuels, usage and a huge variety of variables. We also used data about the countries’ per capita income, from the website of the World Bank.

The data shows that 60.8% of world energy consumption needs are met by oil and coal, which declined to 60.1% in 2019. Since the total energy consumption has risen, there is a significant fall in oil and coal energy consumption, which changed to 349 EJ, in 2019 from 351 EJ in 2018. There was a huge rise in usage of other alternative sources, like Natural gas, nuclear energy, hydroelectric and other renewables, which are relatively cleaner sources, which increased from 225 EJ to 233 EJ.
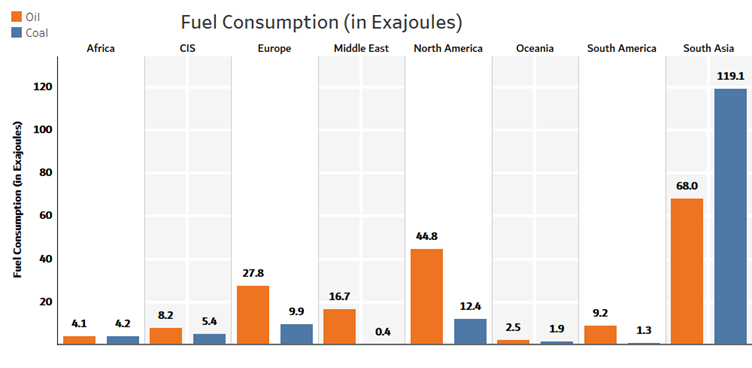
With this large shift, it would be interesting to identify if countries across the world face similar challenges in adopting measures to a cleaner and sustainable world. Out of 66 countries in the data set, the majority of energy consumption in 34 countries is through these cleaner sources. Major producers of Natural Gas, like Iran, Norway, Canada, Turkmenistan, Russia, Algeria, Venezuela and Qatar are also consuming these cleaner resources to meet, at least two-thirds of their energy requirements, of which Natural Gas is the largest contributor. South-East Asian countries are mostly among the lowest users of clean energy, hence primarily depend on conventional sources. Even in China and India, which are leading producers, they haven’t been able to meet their energy demands through cleaner sources, which constitute only 23% and 15% of total energy requirements. This can be traced by the level of per capita energy consumption of Natural Gas which is very low compared to other countries on account of the high population.

USA, Russia, China and Iran are the largest consumer of Natural Gas reserves in the world accounting for 46% of the world’s total consumption of Natural Gas. Nuclear energy meets 4.3% of the world’s energy requirements and the USA followed by France and China are leading consumers of this source. These countries are responsible for 57% of the total Nuclear energy consumption. Out of the 28 nuclear energy-consuming nations (in the dataset), 16 are the OECD nations.

In the year 2018-19, Belgium saw the highest rise in nuclear energy consumption. While the non-OECD nations observed a 9.5% rise in total nuclear energy consumption during this period, most OECD nations experienced a decline, but with a gross rise in nuclear energy use by 0.8% only. The main reason for this decline is the Nuclear power phase-out due to the “anti-nuclear power” sentiment in the countries. Nations like Sweden, Germany, Italy, Austria, the Philippines, Australia, etc have observed popular opposition for this energy, because of several incidents like Fukushima nuclear disaster and other risks.
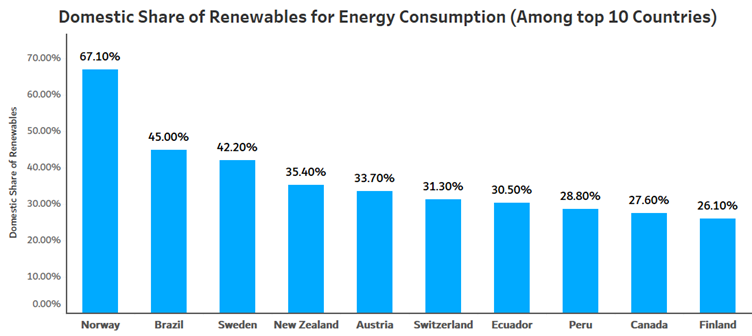
Along with all these sources, energy production is also done through various renewable sources such as solar, wind, tidal, hydroelectric and many different innovations. These are usually classified as non-conventional or simply renewables. Norway, Brazil and Sweden are the countries that have a large share of their energy requirements met by renewables. It is observed that, countries that have a larger share of renewables in their overall consumption, experience negative growths in per capita GDP (13 out of 15 countries with a large share of renewables). Countries that observed a great rise in the consumption of renewables seem to experience a decline in average income.
Per Capita energy consumption or average energy usage is another measure that can be used to trace the countries’ economic growth. We also noted a moderately high positive relationship (0.60) between the average energy consumption and average income. Out of the top 10 countries, which have the highest per capita energy consumption, half of them are the Gulf countries, namely Qatar, Kuwait, UAE, Saudi Arabia, Oman. Others include rich countries like Singapore, Canada, Trinidad and Tobago, Norway and the USA. Highly populated regions like South East Asia are among the countries with the lowest per capita energy consumption. Interestingly, countries in Africa and South America that have relatively higher incomes also have very low per capita energy consumption.

The possible reasons for these groups can be very different from each other. The regions in South East Asia have a disproportionate distribution of energy and is also accompanied by a large population density. And hence, despite the availability of infrastructure, there is low per capita energy usage. In the case of African and South American countries, there is a great deficiency of infrastructure and a rise in income disparity. In the particular case of South America, recent years have seen a decline in incomes and several phases of very high inflation. LikeLike political and social institutions, social infrastructure affect economic growth and consequently the per capita energy consumption.
We also analyzed the carbon dioxide emissions by these countries, which is a negative externality of economic development. China (29%), the USA (14.5%), EU (9.7%), India (7.3%) and followed by Russia, Japan and Iran are the largest contributors to Carbon dioxide emissions, contributing to about 70%. Middle East nations also add up 6.3%, and African and South American nations add 3.8% and 3.7% respectively. The countries where the growth rate of carbon emissions has been highest in 2019 are Vietnam (+20.6%), Bangladesh (+17.7%), Colombia (+11.8%), Morocco (+10.8%) and Turkmenistan (+9.8%).
While there was a huge decline in Estonia (-23.4%), Venezuela (-14.4%), Iceland (-11.5%), Finland (-8.2%), Slovakia (-7.3%). It is interesting to note that in the countries where the growth of carbon dioxide emission was highest in 2019, it was relatively lower in the last decade. For the countries where the decline was highest in 2019, the decline was very low in the last decade (2008-2018). European Union has been committed to reducing its carbon footprint significantly by 2030 and has shown that there is a -3.9% decline in its carbon dioxide emission as compared to a -1.8% decline in the last decade. It has been at -2.9% for all the OECD nations and the non- OECD nations, it tolls up to 2.4%.
The data shows, that still most of the countries and regions across the world are highly dependent on non-renewable resources and dirty fuels, which are non-eco-friendly, i.e, have several negative externalities like global warming, ozone depletion, etc. There is a positive change in the policies of several nations, majorly developed and OECD nations, committing towards a cleaner future, while steps are still needed to be taken to promote renewables across the unprivileged and underdeveloped parts of the world, which contribute significantly to the environment depletion by the usage of conventional sources of the energy. Economic development is closely related to energy consumption and hence, better use of cleaner sources will aim to make economic activities sustainable.



Comments